Table
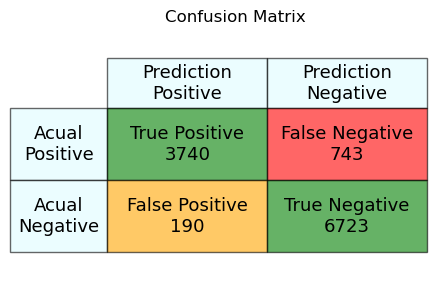
Basic example with a confusion matrix:
import matplotlib.pyplot as plt

cellText = [
    ["True Positive\n3740", "False Negative\n743"],
    ["False Positive\n190", "True Negative\n6723"],
]
cellColours = [
    ["green", "red"],
    ["orange", "green"],
]

fig = plt.figure(figsize=(6, 3), tight_layout=True)
ax1 = fig.add_subplot(111)
ax1.set_axis_off()
table = ax1.table(
    cellText=cellText,
    rowLabels=["Acual\nPositive", "Acual\nNegative"],
    colLabels=["Prediction\nPositive", "Prediction\nNegative"],
    cellLoc="center", # The alignment of the text within the cells.
    rowLoc="center", # The text alignment of the row header cells.
    colLoc="center", # The text alignment of the column header cells.
    colWidths = [0.4, 0.4],
    cellColours=cellColours,
    rowColours=["#DFFCFF", "#DFFCFF"],
    colColours=[(0.875, 0.99, 1), (0.875, 0.99, 1)],
    loc='center right'
)
table.set_fontsize(34)
table.scale(1, 4)
# Set the height of the header cells
cellDict = table.get_celld()
for i in range(0, 2):
    cellDict[(0, i)].set_height(.2)
# Set the opacity of the cells
for cell in table._cells:
    table._cells[cell].set_alpha(.6)
ax1.set_title("Confusion Matrix")
fig.savefig("table.png", bbox_inches='tight')
plt.close(fig)
Sources:
matplotlib.pyplot.table: https://matplotlib.org/stable/api/_as_gen/matplotlib.pyplot.table.html