Scatter
In this example we used a sequence of value for c, the accepted values for c argument are:
A scalar or sequence of n numbers to be mapped to colors using cmap and norm.
A 2D array in which the rows are RGB or RGBA.
A sequence of colors of length n.
A single color format string.
import matplotlib.pyplot as plt
import numpy as np
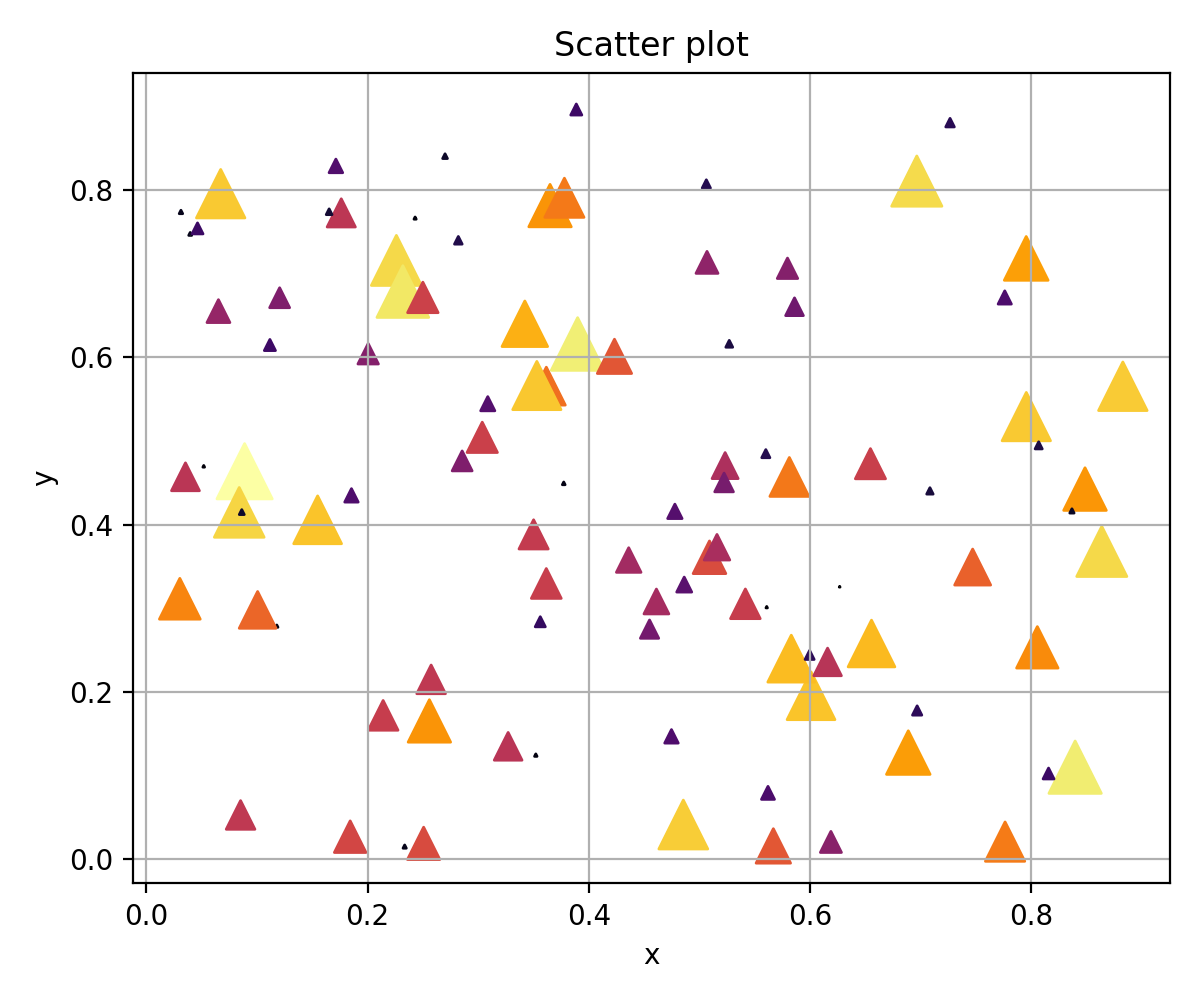
N = 100
x = 0.9 * np.random.rand(N)
y = 0.9 * np.random.rand(N)
s = (20 * np.random.rand(N)) ** 2
c = np.sqrt(s)
fig = plt.figure(figsize=(6, 5), tight_layout=True)
ax1 = fig.add_subplot(111)
ax1.grid()
ax1.set_xlabel("x")
ax1.set_ylabel("y")
ax1.set_title("Scatter plot")
sct = ax1.scatter(x, y, s=s, c=c, cmap="inferno", marker='^')
fig.savefig("scatter.png", dpi=200)
Sources:
scatter ; matplotlib: https://matplotlib.org/stable/api/_as_gen/matplotlib.pyplot.scatter.html