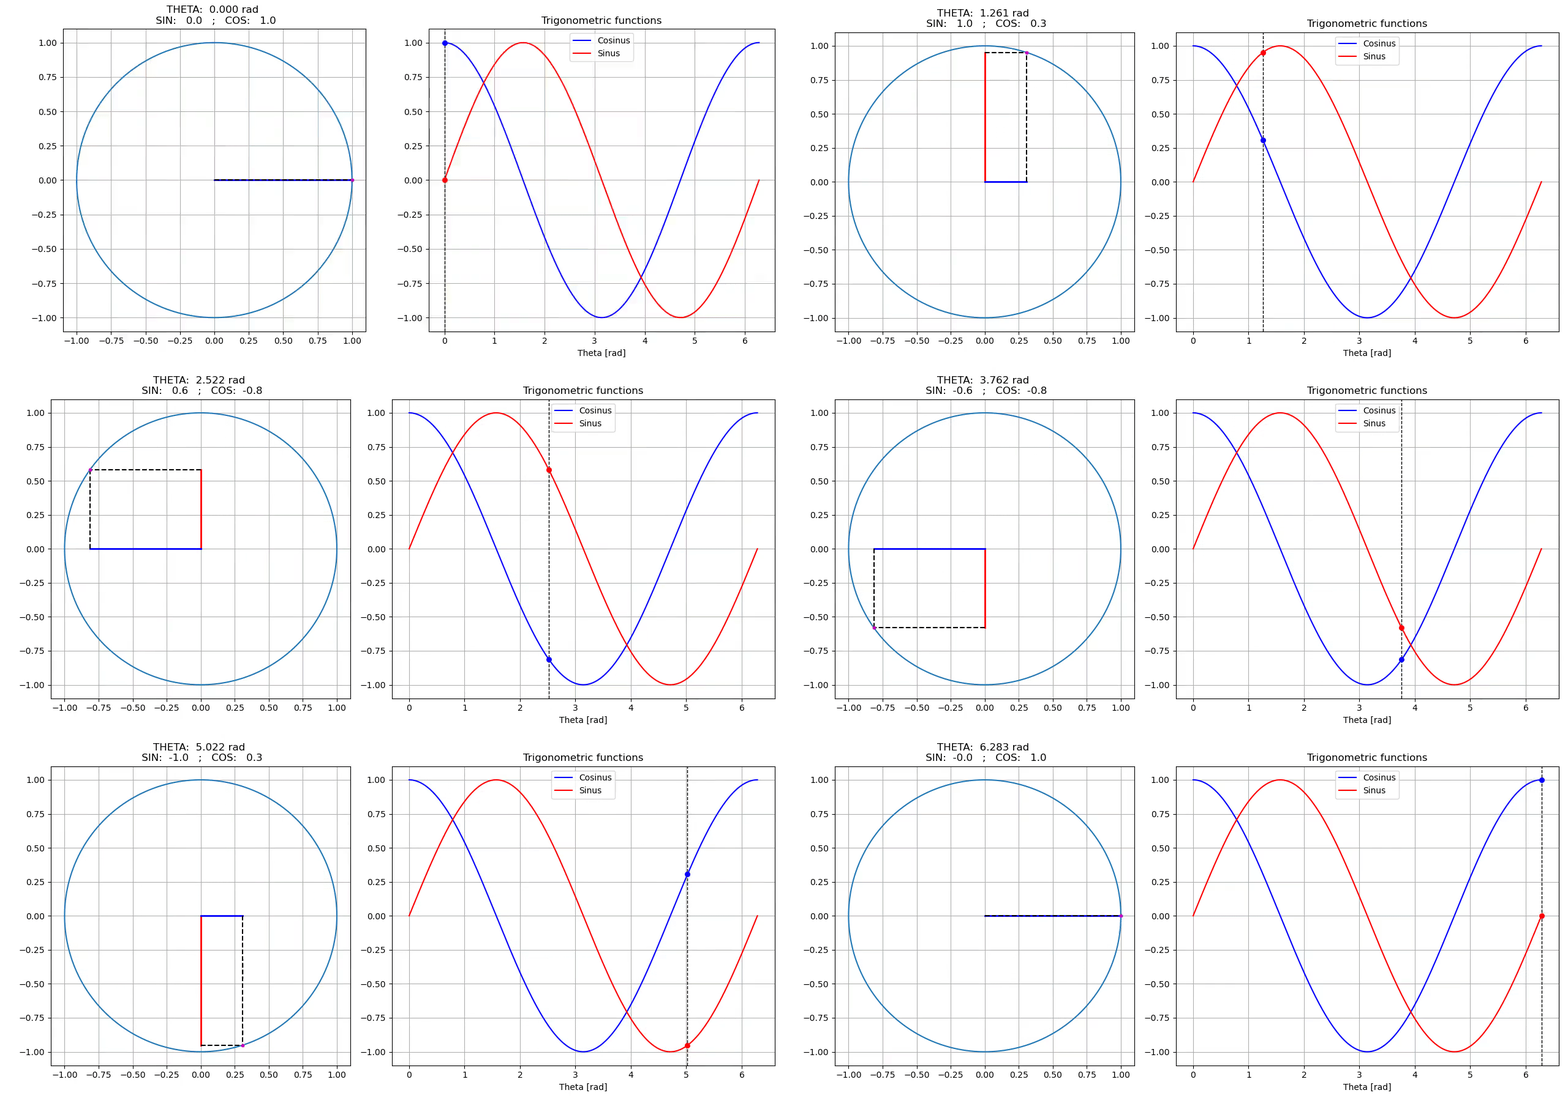
Animation
Below is an example of an animated figure, 3 methods are then used to save the animation to a video file.
import matplotlib.pyplot as plt
from typing import Tuple
from numbers import Number
import numpy as np

class SinusCosinusFigure():
    def __init__(self, resolution:Tuple[int, int], dpi:int = 100):
        """
            resolution: (nb pixel width, nb pixel height)
        """
        self.fig = plt.figure(figsize=tuple(np.array(resolution) / dpi), tight_layout=True)
        self.ax_circle = self.fig.add_subplot(121)
        self.ax_sincos = self.fig.add_subplot(122)
        self.init_draw()

    def init_draw(self) -> None:
        theta = np.linspace(0, 2*np.pi, 200)
        cos_theta = np.cos(theta)
        sin_theta = np.sin(theta)
        # Draw the circle
        self.ax_circle.grid()
        self.ax_circle.plot(cos_theta, sin_theta)
        self.ax_circle.axis('scaled')
        # Cos & Sin Lines
        self.line_sin = self.ax_circle.plot([], [], linewidth=2.0, color="r")
        self.line_cos = self.ax_circle.plot([], [], linewidth=2.0, color="b")
        # Cos & Sin Dashed lines
        self.line_sin_p = self.ax_circle.plot([], [], linestyle="--", color="k")
        self.line_cos_p = self.ax_circle.plot([], [], linestyle="--", color="k")
        # Point on the circle
        self.circle_point = self.ax_circle.scatter([], [], s=10, c='m', zorder=1000)
        # Sinux Cosinus Curves
        self.ax_sincos.grid()
        self.ax_sincos.set_xlabel("Theta [rad]")
        self.ax_sincos.set_title("Trigonometric functions")
        self.ax_sincos.plot(theta, cos_theta, color='b', label="Cosinus")
        self.ax_sincos.plot(theta, sin_theta, color='r', label="Sinus")
        self.ax_sincos.legend(loc="upper center")
        self.vline = self.ax_sincos.axvline(np.nan, linestyle='--', linewidth=1.0, color="k")
        self.point_sin = self.ax_sincos.scatter([], [], s=30, c='r', zorder=1000)
        self.point_cos = self.ax_sincos.scatter([], [], s=30, c='b', zorder=1000)

    def update(self, theta: Number) -> None:
        cos_theta = np.cos(theta)
        sin_theta = np.sin(theta)
        # Updating scatter
        self.circle_point.set_offsets([cos_theta, sin_theta])
        self.point_sin.set_offsets([theta, sin_theta])
        self.point_cos.set_offsets([theta, cos_theta])
        # Updating plot
        self.line_sin[0].set_data([0, 0], [0, sin_theta])
        self.line_cos[0].set_data([0, cos_theta], [0, 0])
        self.line_sin_p[0].set_data([cos_theta, cos_theta], [0, sin_theta])
        self.line_cos_p[0].set_data([0, cos_theta], [sin_theta, sin_theta])
        # Updating axvline
        self.vline.set_xdata(theta)
        # Updating title
        self.ax_circle.set_title(f"THETA: {theta: 6.3f} rad \n SIN: {sin_theta: 5.1f}   ;   COS: {cos_theta: 5.1f}")


# Initialisation of the figure
resolution = (1280, 600)
dpi = 100
figext = SinusCosinusFigure(resolution, dpi)
The figure can be updated using the method ‘update’ (figext.update(np.pi)).
Now, we’ll see 3 methods to generate a video using an animated figure.
Saving frames one by one
for k, theta in enumerate(np.linspace(0, 2*np.pi, 100)):
    figext.update(theta)
    figext.fig.savefig("img_%05d.png" % k, dpi=dpi)
    # Progression
    print(f"\rFrame: {k:04d} / 100", end="")
The video can be generated using the following command:
ffmpeg -framerate 30 -i img_%05d.png video_manual.mp4
Saving using Buffer + OpenCV
import cv2
import io

# Choose codec according to format needed
fourcc = cv2.VideoWriter_fourcc(*'DIVX') # *'mp4v' *'H264' *"MJPG" *'x264'
FPS = 30
writer = cv2.VideoWriter("video_opencv.avi", fourcc, FPS, resolution)
for k, theta in enumerate(np.linspace(0, 2*np.pi, 100)):
    figext.update(theta)
    io_buf = io.BytesIO()
    figext.fig.savefig(io_buf, format='rgba', dpi=dpi)
    io_buf.seek(0)
    buffer = np.frombuffer(io_buf.getvalue(), dtype=np.uint8)
    io_buf.close()
    img_arr = buffer.reshape((resolution[1], resolution[0], -1))[:,:,::-1][:,:,1:4]
    writer.write(img_arr)
    # Progression
    print(f"\rFrame: {k:04d} / 100", end="")
cv2.destroyAllWindows()
writer.release()
Saving using FuncAnimation
import matplotlib.animation as animation

Writer = animation.writers['ffmpeg']
writer = Writer(fps=30, metadata=dict(artist='Me'), bitrate=1800)
line_ani = animation.FuncAnimation(figext.fig, figext.update, np.linspace(0, 2*np.pi, 100), interval=40, blit=False)
line_ani.save("video_funcanimation.mp4", writer=writer)
Results using one of the above saving method:
