Bar
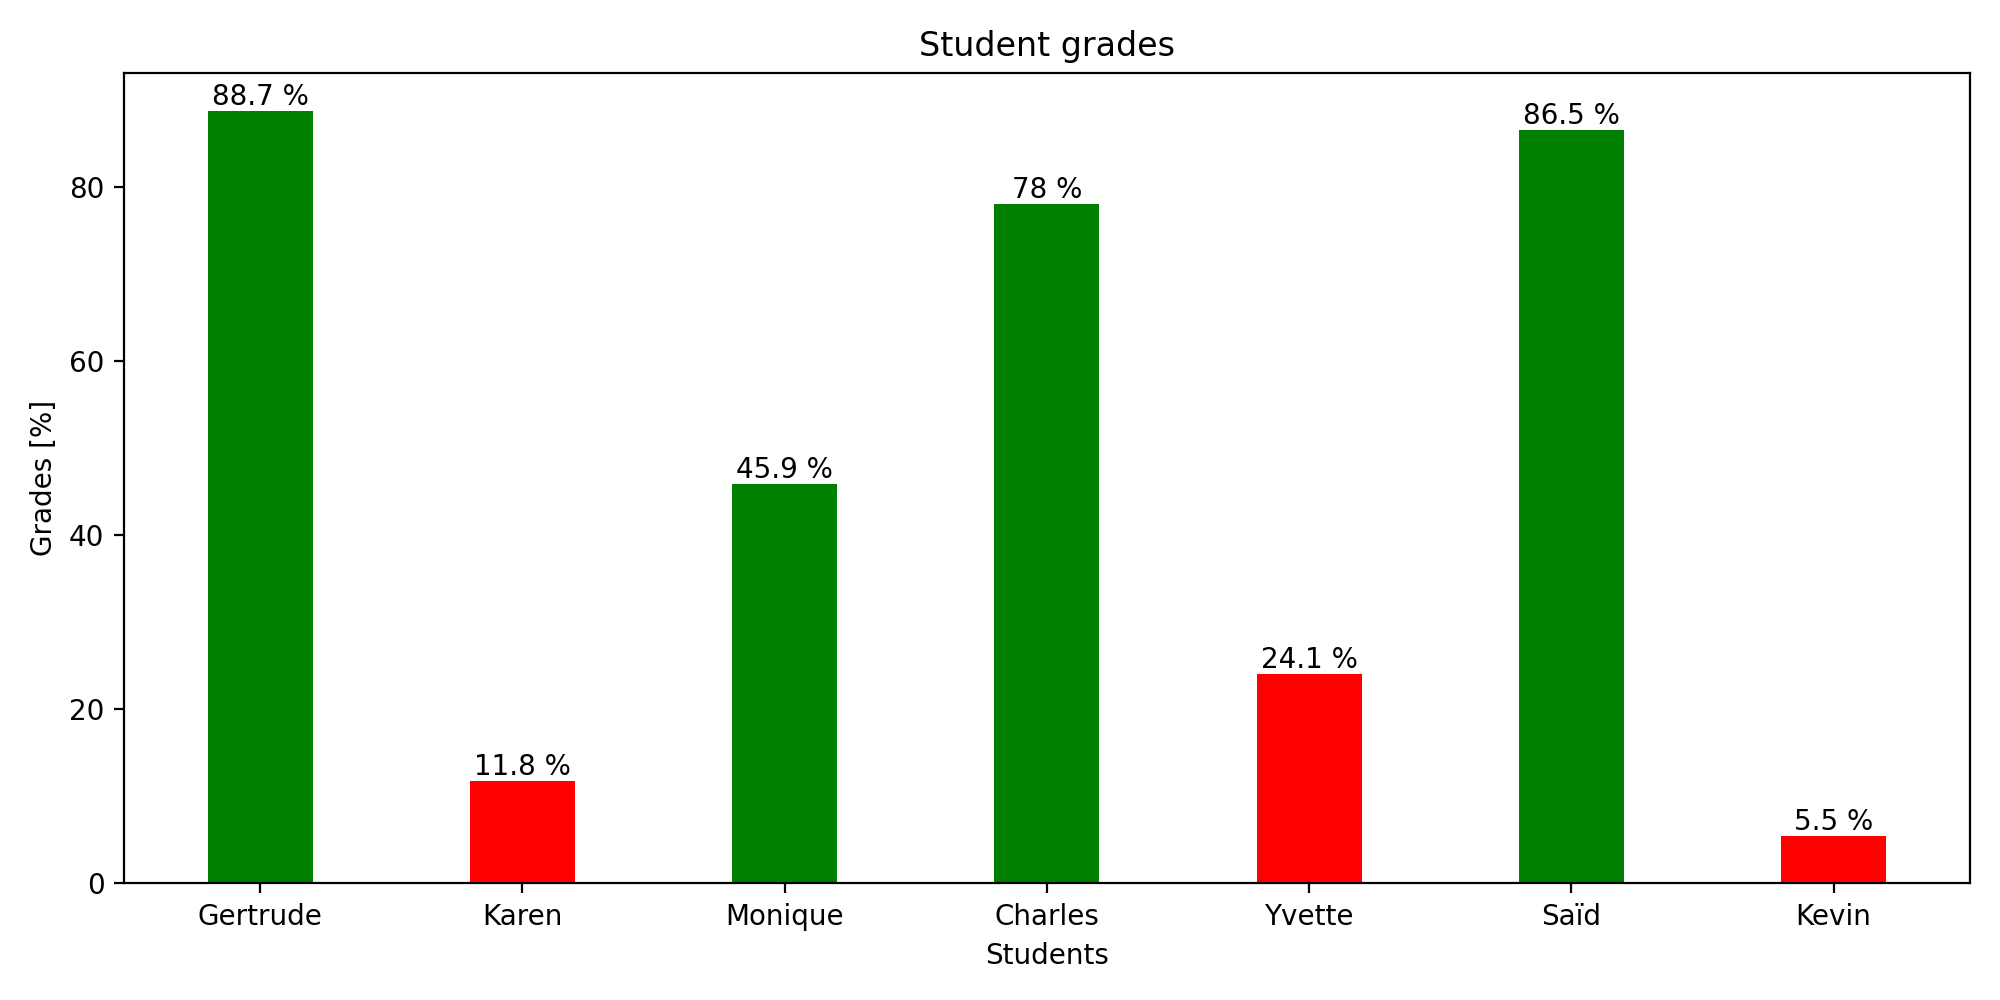
Basic example:
import numpy as np
import matplotlib.pyplot as plt

data = {
    "Gertrude": 88.7,
    "Karen":    11.8,
    "Monique":  45.9,
    "Charles":  78.0,
    "Yvette":   24.1,
    "Saïd":     86.5,
    "Kevin":    5.5,
}
names, grades = tuple(zip(*data.items()))
colors = ["red" if (grade < 30) else "green" for grade in grades]

fig = plt.figure(figsize = (10, 5), tight_layout=True)
ax1 = fig.add_subplot(111)
b1 = ax1.bar(names, grades, color=colors, width = 0.4)
ax1.set_xlabel("Students")
ax1.set_ylabel("Grades [%]")
ax1.set_title("Student grades")
ax1.bar_label(b1, fmt="%g %%")
fig.savefig("bar_example_1.png", dpi=200)
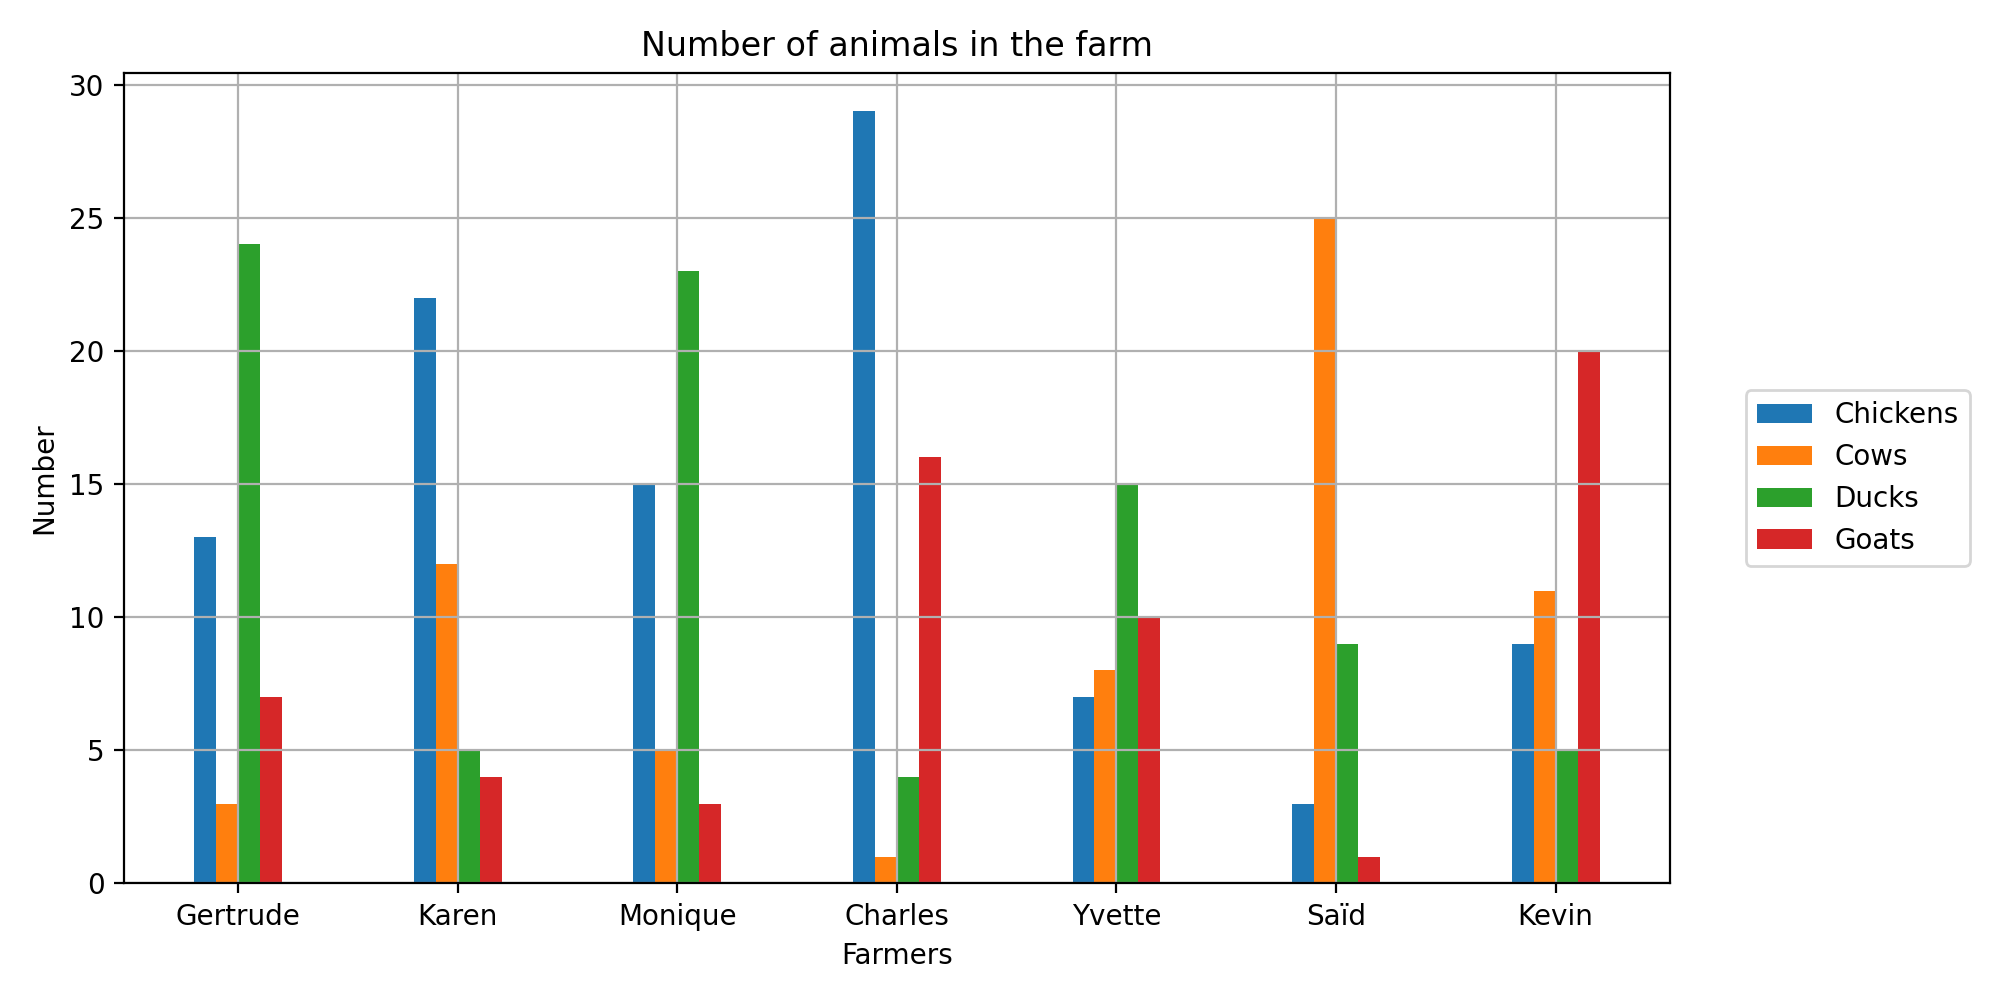
Example with multiple bars side by side:
import numpy as np
import matplotlib.pyplot as plt

data = {
    "Gertrude": {"Chickens": 13, "Cows": 3,  "Ducks": 24, "Goats": 7},
    "Karen":    {"Chickens": 22, "Cows": 12, "Ducks": 5,  "Goats": 4},
    "Monique":  {"Chickens": 15, "Cows": 5,  "Ducks": 23, "Goats": 3},
    "Charles":  {"Chickens": 29, "Cows": 1,  "Ducks": 4,  "Goats": 16},
    "Yvette":   {"Chickens": 7,  "Cows": 8,  "Ducks": 15, "Goats": 10},
    "Saïd":     {"Chickens": 3,  "Cows": 25, "Ducks": 9,  "Goats": 1},
    "Kevin":    {"Chickens": 9,  "Cows": 11, "Ducks": 5,  "Goats": 20},
}
names, nb_animals = tuple(zip(*data.items()))
animals = list(data.values())[0].keys()

width = 0.1
fig = plt.figure(figsize = (10, 5), tight_layout=True)
ax1 = fig.add_subplot(111)
for ind_ani, animal in enumerate(animals):
    numbers = np.array([ani[animal] for ani in nb_animals])
    b1 = ax1.bar(np.arange(len(names)) + width * ind_ani, numbers, width=width, label=animal)
ax1.set_xlabel("Farmers")
ax1.set_ylabel("Number")
ax1.set_title("Number of animals in the farm")
ax1.grid()
ax1.legend(loc='center left', bbox_to_anchor=(1.04, 0.5))
ax1.set_xticks(np.arange(len(names)) + ((len(animals) - 1) * width) / 2, names)
fig.savefig("bar_example_2.png", dpi=200)
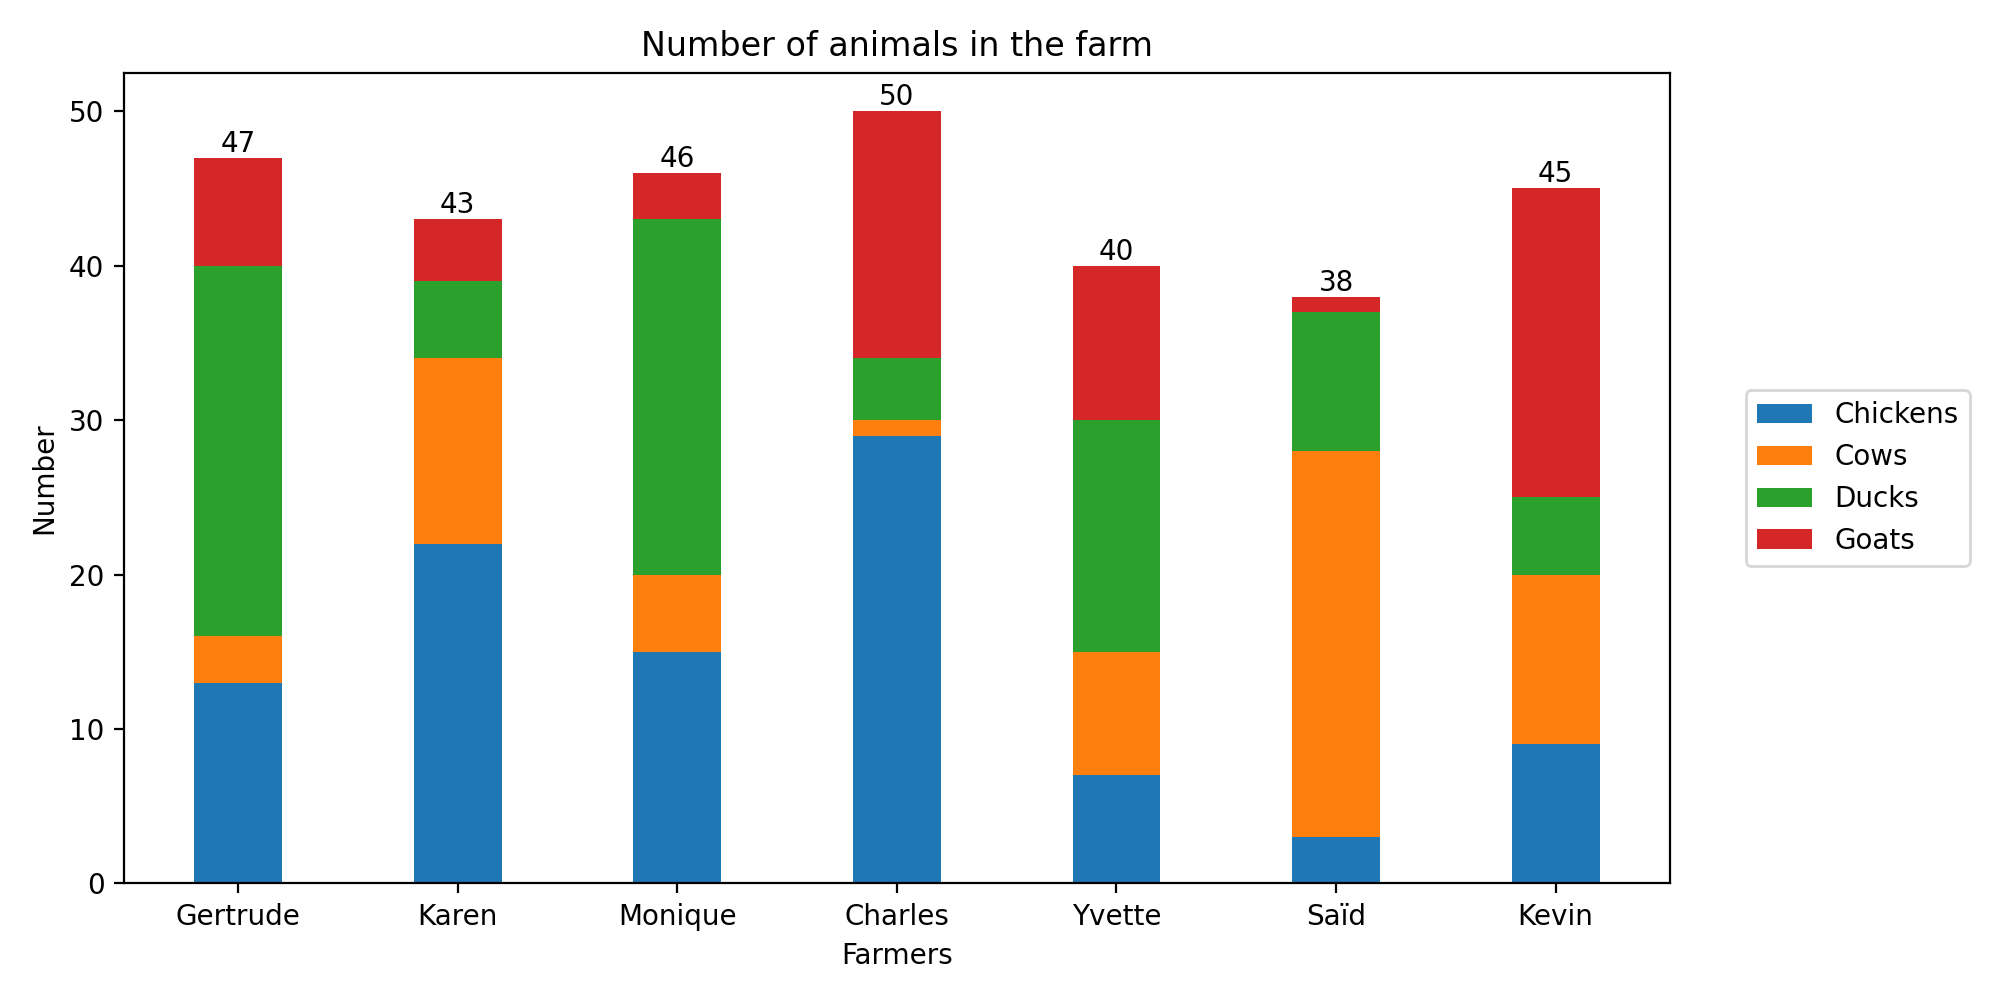
Example of stacked bars:
import numpy as np
import matplotlib.pyplot as plt

data = {
    "Gertrude": {"Chickens": 13, "Cows": 3,  "Ducks": 24, "Goats": 7},
    "Karen":    {"Chickens": 22, "Cows": 12, "Ducks": 5,  "Goats": 4},
    "Monique":  {"Chickens": 15, "Cows": 5,  "Ducks": 23, "Goats": 3},
    "Charles":  {"Chickens": 29, "Cows": 1,  "Ducks": 4,  "Goats": 16},
    "Yvette":   {"Chickens": 7,  "Cows": 8,  "Ducks": 15, "Goats": 10},
    "Saïd":     {"Chickens": 3,  "Cows": 25, "Ducks": 9,  "Goats": 1},
    "Kevin":    {"Chickens": 9,  "Cows": 11, "Ducks": 5,  "Goats": 20},
}
names, animals = tuple(zip(*data.items()))

fig = plt.figure(figsize = (10, 5), tight_layout=True)
ax1 = fig.add_subplot(111)
offset = np.zeros(len(names))
for animal in list(list(data.values())[0].keys()):
    numbers = np.array([ani[animal] for ani in animals])
    b1 = ax1.bar(names, numbers, bottom=offset, width = 0.4, label=animal)
    offset += numbers
ax1.set_xlabel("Farmers")
ax1.set_ylabel("Number")
ax1.set_title("Number of animals in the farm")
ax1.bar_label(b1)
ax1.legend(loc='center left', bbox_to_anchor=(1.04, 0.5))
fig.savefig("bar_example_3.png", dpi=200)
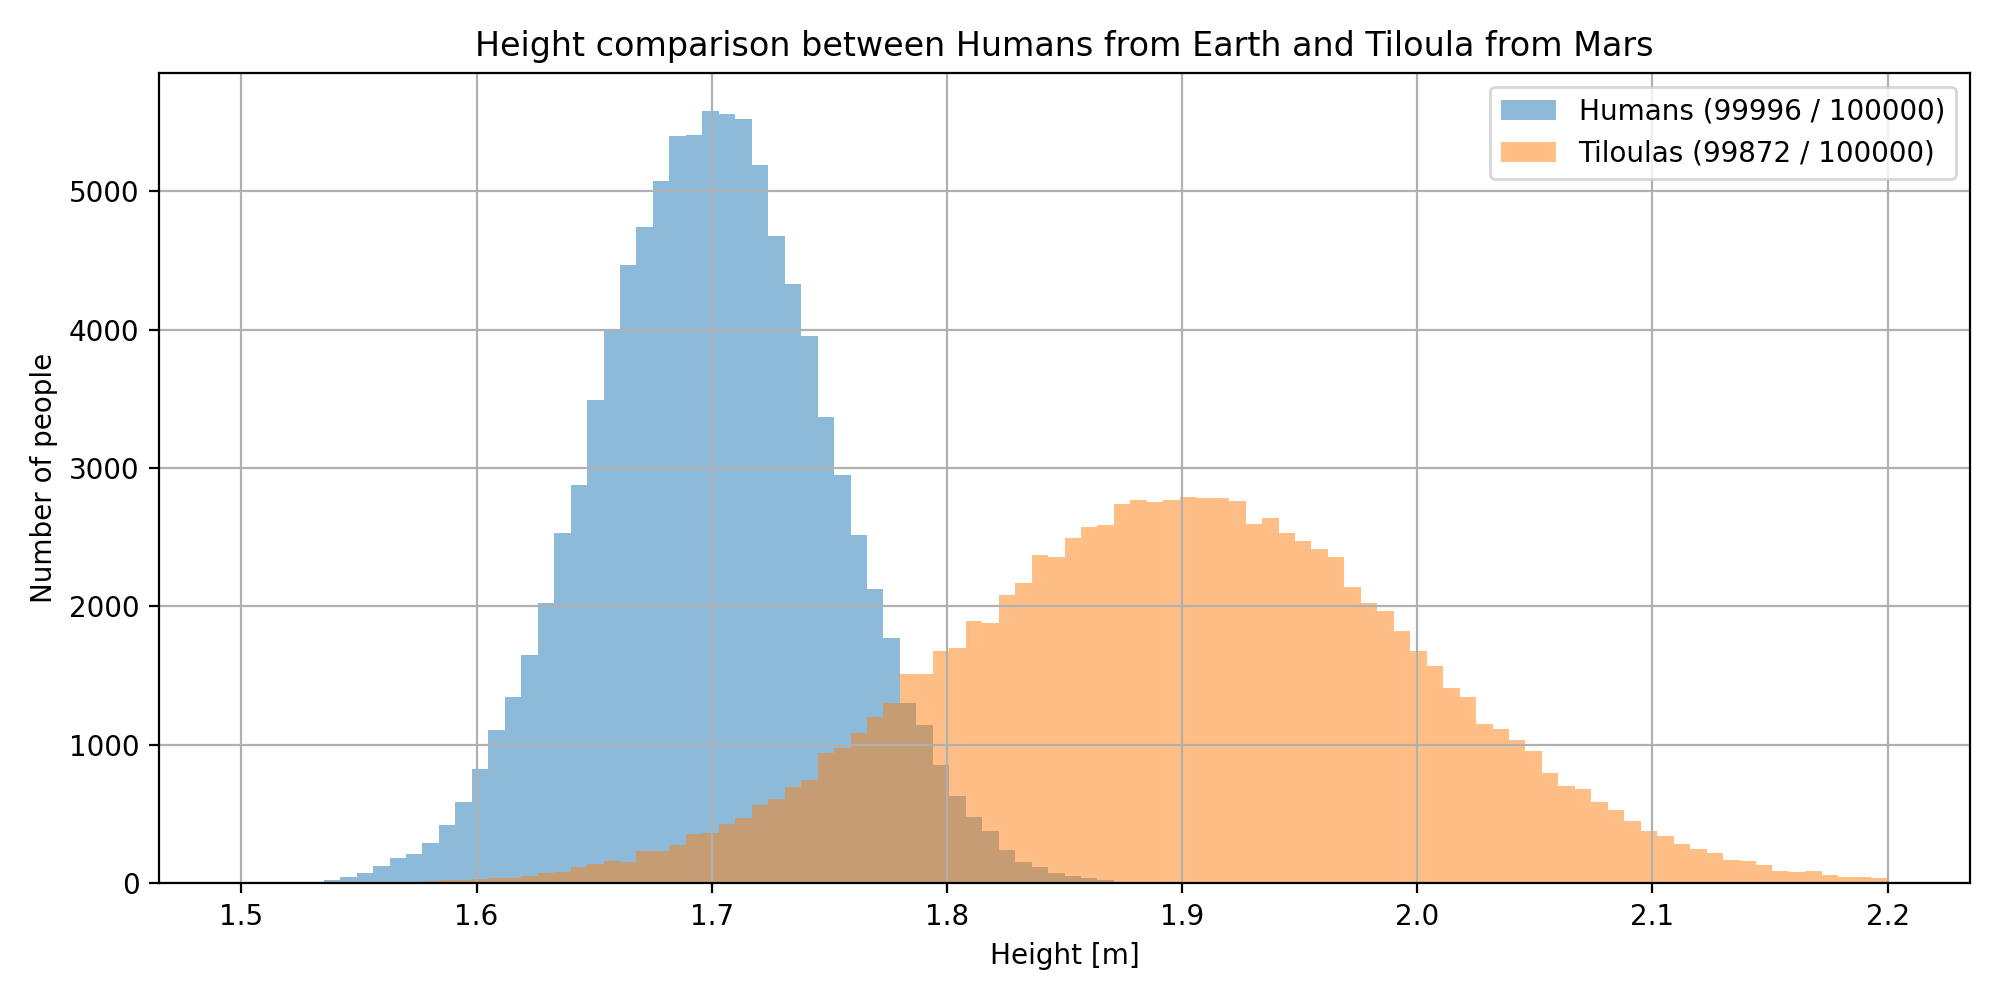
Example using bar to plot multiple histograms:
import matplotlib.pyplot as plt
import numpy as np

N = 100000

humans_from_earth = 1.7 + 0.05 * np.random.randn(N)
tiloula_from_mars = 1.9 + 0.1 * np.random.randn(N)

# Histogram parameters
height_min = 1.5
height_max = 2.2
bins = 100

fig = plt.figure(figsize = (10, 5), tight_layout=True)
ax1 = fig.add_subplot(111)
ax1.set_xlabel("Height [m]")
ax1.set_ylabel("Number of people")
ax1.set_title("Height comparison between Humans from Earth and Tiloula from Mars")
ax1.grid()
for (label, population) in [("Humans", humans_from_earth), ("Tiloulas", tiloula_from_mars)]:
    histo, x = np.histogram(population, range=(height_min, height_max), bins=bins)
    xbar = x[0:-1] + (x[1] - x[0]) / 2
    width = (np.max(x) - np.min(x)) / bins
    out_of_range = N - np.sum(histo)
    ax1.bar(xbar, histo, width=width, label=f"{label} ({np.sum(histo)} / {len(population)})", alpha=0.5)
ax1.legend(loc='upper right')
fig.savefig("bar_example_4.png", dpi=200)
Sources:
matplotlib.pyplot.bar: https://matplotlib.org/stable/api/_as_gen/matplotlib.pyplot.bar.html