Pie Chart
import matplotlib.pyplot as plt
# Pie chart, where the slices will be ordered and plotted counter-clockwise:
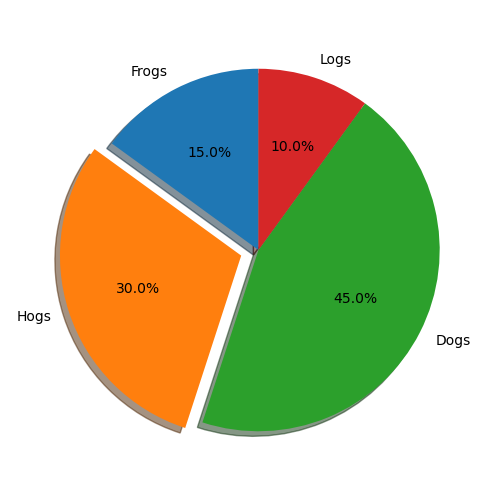
labels = 'Frogs', 'Hogs', 'Dogs', 'Logs'
sizes = [15, 30, 45, 10]
explode = (0, 0.1, 0, 0) # only "explode" the 2nd slice (i.e. 'Hogs')
fig = plt.figure(figsize=(5, 5), tight_layout=True)
ax1 = fig.add_subplot(111)
ax1.pie(sizes, explode=explode, labels=labels, autopct='%1.1f%%',
shadow=True, startangle=90)
# If necessary: Equal aspect ratio ensures that pie is drawn as a circle.
# ax1.axis('equal')
fig.savefig("pie_chart.png")
Sources:
matplotlib.pyplot.pie: https://matplotlib.org/stable/api/_as_gen/matplotlib.pyplot.pie.html
Pie Chart Example https://matplotlib.org/stable/gallery/pie_and_polar_charts/pie_features.html