Image
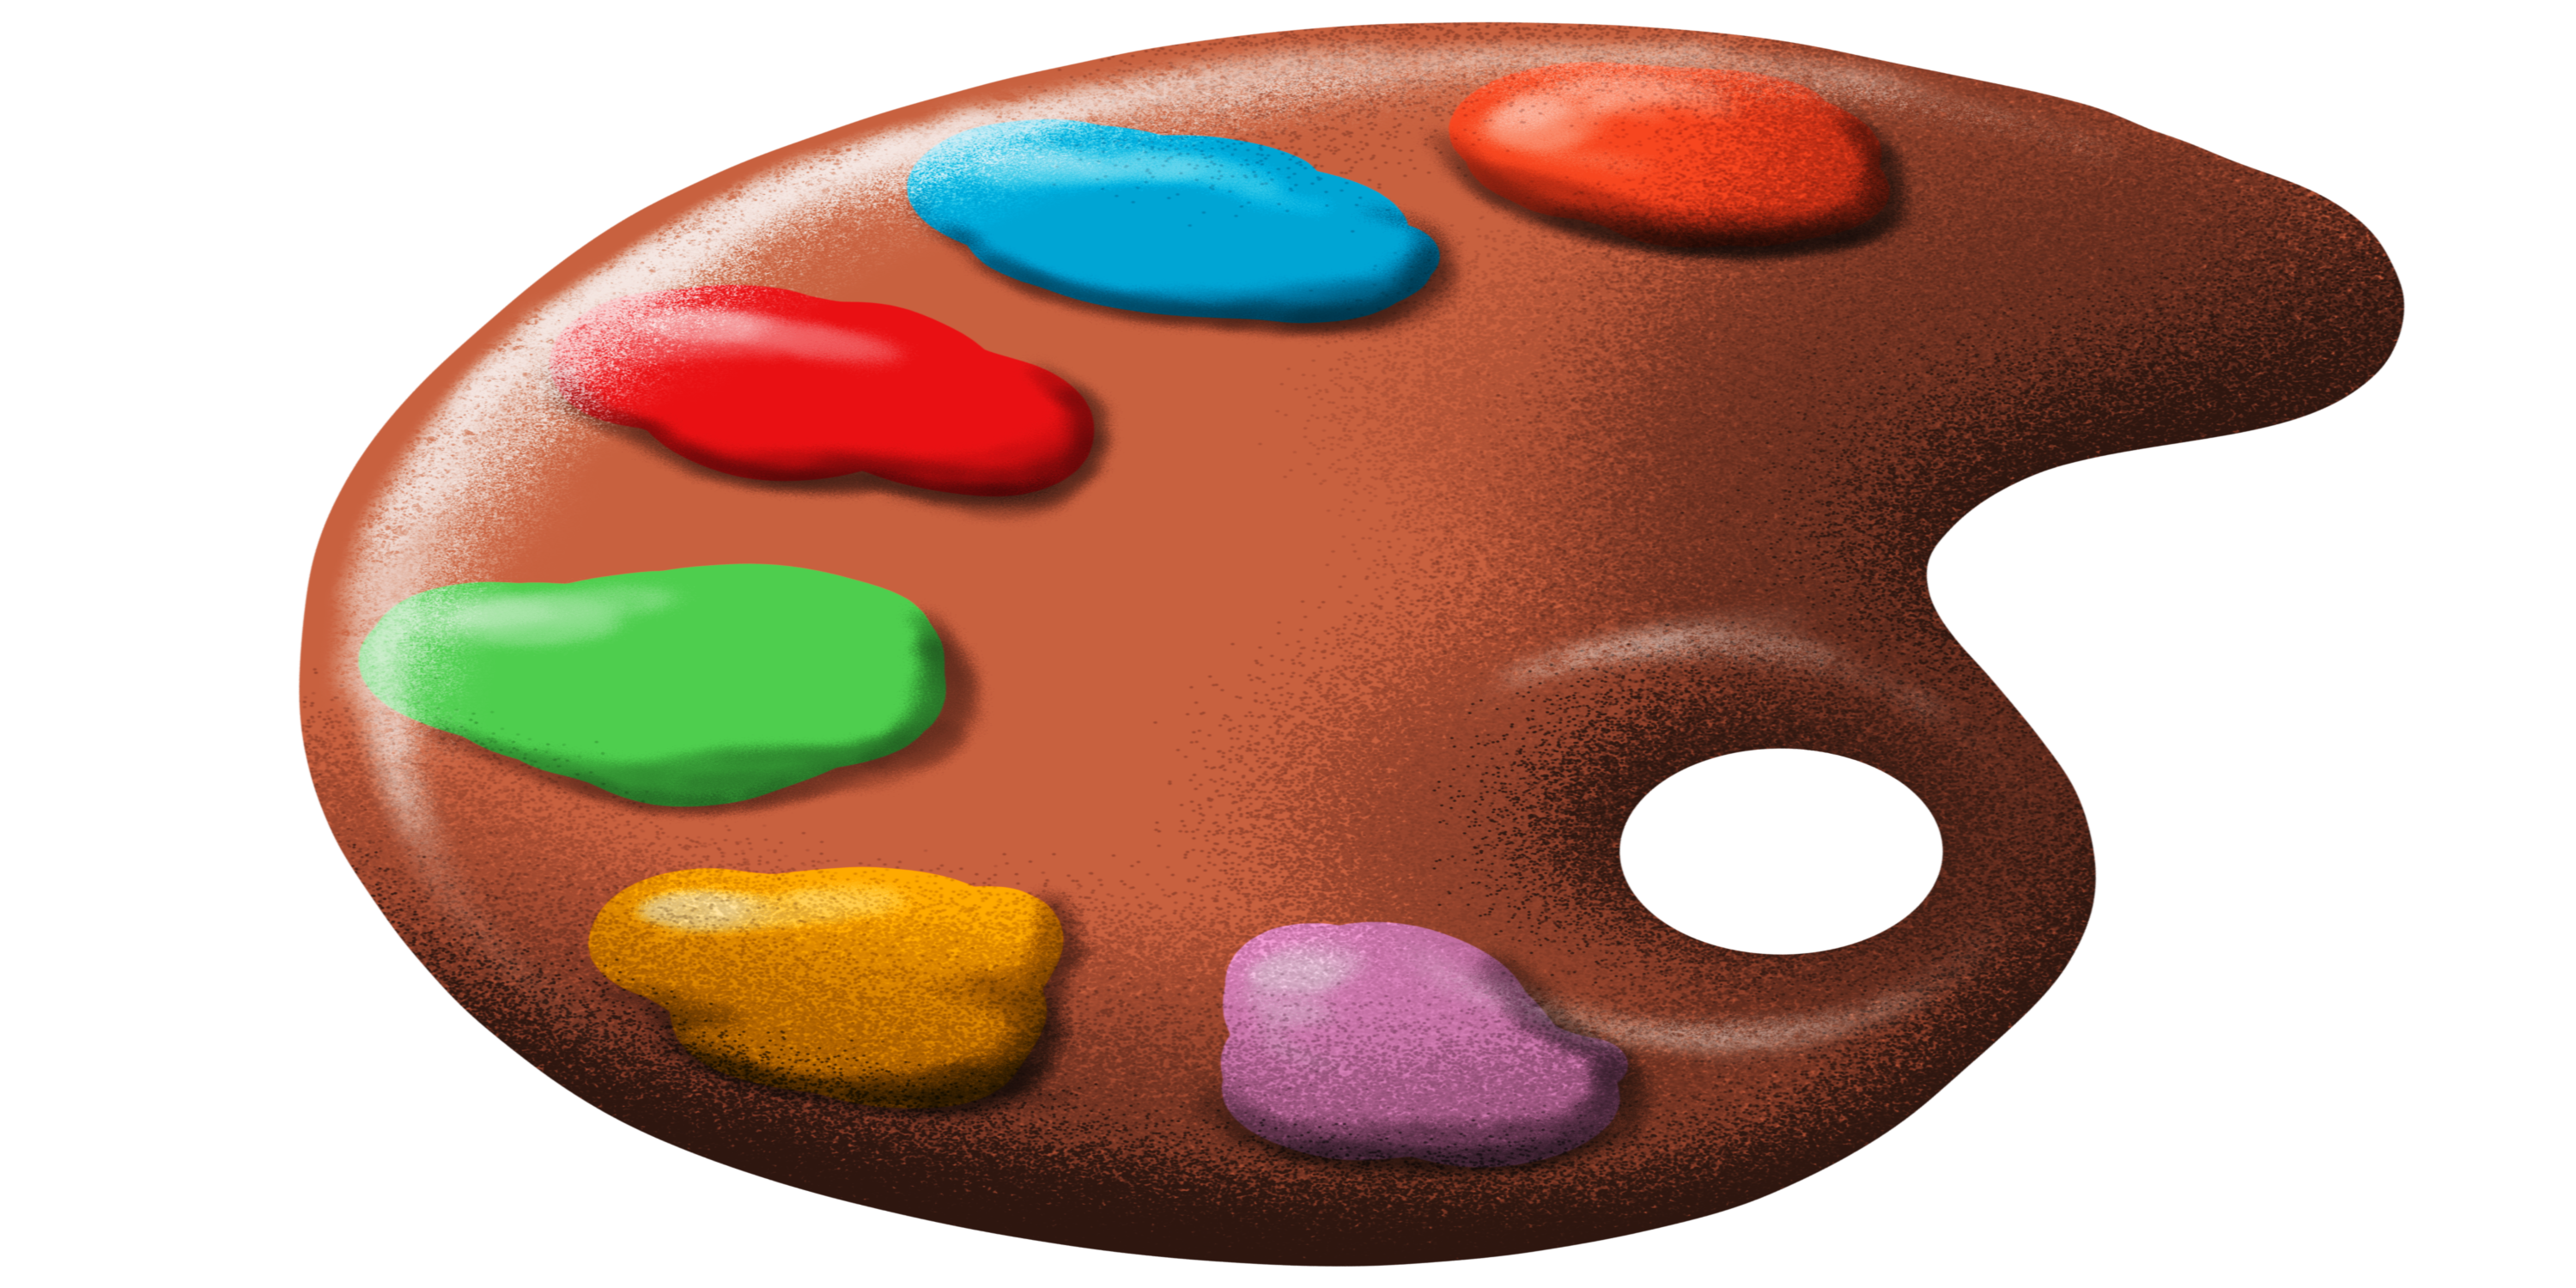
Image used in our examples (3000x1500) with transparent background (alpha channel):
Download: paint.png

Load/Show/Save an image with Pillow
You can install Pillow with the command:
conda install -c anaconda pillow
from PIL import Image as PImage
import numpy as np

# Open the image
img = PImage.open("paint.png")

# Get the raw data, shape = (Height, Length, RGB[A] )
data = np.array(img)

# Plot the image
img.show()

# Modify the current image data and save it
# input data format: [...] Copies pixel data from a flattened sequence object into the image [...]
# Flatten only the first 2 dimensions (height and width)
data_flatten = data.reshape(-1, *data.shape[2:])
if len(data_flatten.shape) > 1:
    # If the image has more than 1 channel
    # Convert the array to a list of tuples
    data_flatten = list(map(tuple, np.vstack(data_flatten)))
img.putdata(data_flatten)
img.save("paint_new.png")

# Create a new image object from raw data and save it
img_new = PImage.fromarray(data)
img_new.save("paint_new.png")
Load/Show/Save an image with OpenCV
You can install OpenCV with the command:
conda install -c conda-forge opencv
import cv2

# Open the image
data = cv2.imread("paint.png", cv2.IMREAD_UNCHANGED) # cv2.IMREAD_GRAYSCALE or cv2.IMREAD_COLOR
# data shape = ( Height, Length, BGR[A] )

# Plot the image
cv2.imshow("image", data)
cv2.waitKey(0)
cv2.destroyAllWindows()

# Save the image
status = cv2.imwrite('paint_new.png', data)
Plot an image with Matplotlib
import matplotlib.pyplot as plt
from PIL import Image as PImage
import numpy as np
# Open the image
img = PImage.open("paint.png")
# Get the color raw data, shape = ( Height, Length, RGB[A] )
data_color = np.array(img)
# Get the grayscale raw data, shape = ( Height, Length )
data_gray = np.array(img.convert('L'))
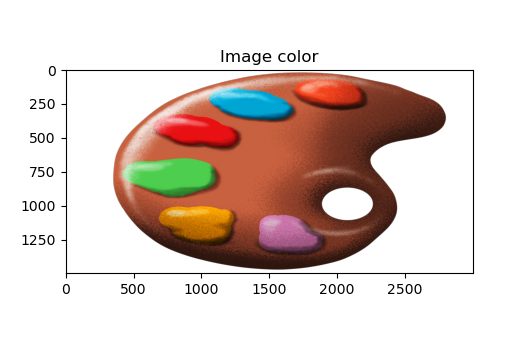
# Plot the image with imshow
# imshow => Conserve the ratio (can be changed with 'aspect' argument)
# Automatically invert the Y axis (image coordinates)
# Plot a colored image, shape expected: (height, length, RGB[A])
fig, ax = plt.subplots()
ims_color = ax.imshow(data_color)
ax.set_title("Image color")
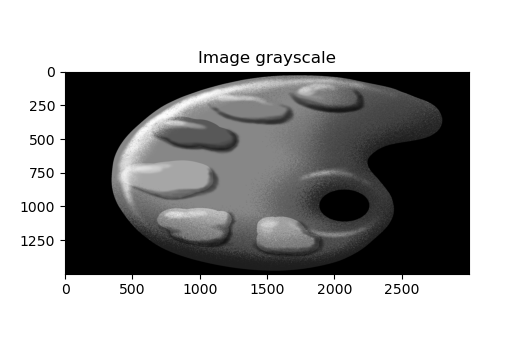
# Plot a grayscale image, shape expected: (height, length)
fig, ax = plt.subplots()
ims_gray = ax.imshow(data_gray, cmap="gray")
ax.set_title("Image grayscale")
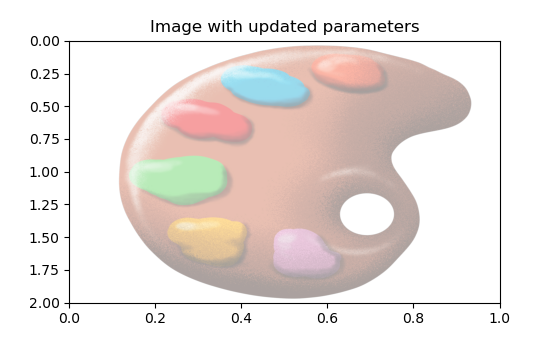
# Playing with the parameters
fig, ax = plt.subplots()
ims_opt = ax.imshow(data_color, extent=[0, 1, 2, 0], aspect='auto', alpha=0.4)
ax.set_title("Image with updated parameters")
# aspect='auto' => ratio is not conserved, adapting to the size of the figure
# extend=[Ymin, Ymax, Xmin, Xmax] => set the coordinates of the image
# alpha => add transparency to the whole image ax
Sources:
Pillow documentation: https://pillow.readthedocs.io/en/stable
OpenCV documentation: https://docs.opencv.org/4.x/